-

长沙力高捷创仪器有限公司
主营:PSM1700,频率特性分析仪,环路分析仪 - 18665876229

长沙力高捷创仪器有限公司
主营:PSM1700,频率特性分析仪,环路分析仪 12
12
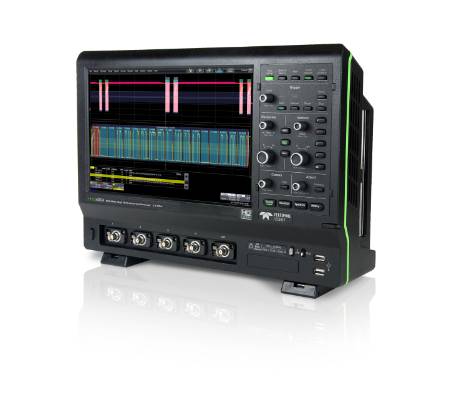
美国力科LECROY HDO4000系列12位高分辨率数字存储示波器 HDO4022 HDO4024 HDO4032 HDO4034 HDO4054

长沙泰克示波器 长沙泰克电源 长沙力科示波器 长沙力科电源 长沙安捷伦示波器 长沙力科电源 长沙安捷伦示波器 长沙安捷伦电源 长沙福禄克万用表 湖南福禄克万用表  高压探头 电流探头  湖南泰克示波器 湖南泰克电源  湖南力科示波器  湖南力科电源  湖南安捷伦示波器  湖南力科电源  湖南安捷伦示波器  湖南安捷伦电源  高压探头 电流探头

一、产品简介
HDO4000系列示波器应用Teledyne LeCroy的HD4096 技术,结合长存储深度、紧凑轻巧的结构设计、12.1”多点触摸显示屏和强大的调试软件工具,提供给用户精确测量和快速调试的理想示波器。示波器内置的WaveScan波形搜索和查找工具、LabNotebook 报告生成工具、历史模式等,帮助确认和隔离问题信号,为快速解决电路故障提供较佳解决方案。

二、产品特点
●   12-bit ADCs 垂直分辨率,增强分辨率模式下达到15-bit
●   200MHz, 350MHz, 500MHz, 1GHz 带宽分布
●  长存储-较高至50Mpts/通道
●   12.1”触摸显示屏,1280×800分辨率
●  多语言用户界面
●   WaveScan-高级搜索和查找工具
●   LabNotebook 归档和报告生成工具
●   历史回放模式-波形回放和测量
●  专业的频谱分析软件
●  功率信号分析软件包
●  串行数据触发和解码
HD4096 高分辨率技术
HD4096 高分辨率技术包含高采样率的ADCs,高信噪比的前置输入放大器和低噪声的系统架构。使用HD4096 技术的示波器可以精确采集和测量高达1GHz带宽、高采样率和比传统8-bit示波器高达16倍的垂直分辨精度。
长存储深度
较高至 50 Mpts 存储深度的HDO4000系列高分辨率示波器可以高精度的捕获大量的数据信息,以作为后期处理的依据。结合2.5GS/s和 50 Mpts存储深度的架构令您在长时间采集和快速脉冲捕获都游刃有余。
** 大 1 2 . 1”触 摸 屏 幕
HDO4000上使用了12.1”**大的触摸屏设计,使示波器上复杂的用户操作界面已经成为了过去。同时示波器上的用户界面专为触摸屏幕和鼠标操作而设计,而使示波器的操作变得异常简单,即使没有使用过力科示波器的用户也能够轻松上手!因为不论是通道、时基、触发还是自动化测试都可以一触完成!
更为灵巧的尺寸
您一定难以想象如此高性能的仪器还能够拥有纤细的身材,拥有1 2 . 1”** 大 屏 幕 的 同 时只保 持了 5”的仪 器深 度 和 如 此便 携的 体 积。同时,HDO4000 创新性的外观工业设计能够保持 4 种不同的仪器倾斜位置和视角,您可以随心所欲将它摆在实验室的任何位置。

三、产品详细参数
HD4096 High Definition Technology
HD4096 high definition technology enables oscilloscopes to capture and display **s of up to 1 GHz with high sample rate and 16 times more resolution than other oscilloscopes.


Benefits of HD4096 Technology
Waveforms captured and displayed on oscilloscopes with HD4096 technology are cleaner and crisper. Signal details often lost in the noise are clearly visible and easy to distinguish HD4096 enables oscilloscopes to deliver unmatched measurement precision for improved debug and analysis.


Touch Screen Simplicity
Easily control channels, trigger, math and measurements with the large multi-touch display and intuitive interface.


Advanced Math and Measure
Use automatic measurement parameters and math functions to understand every waveform detail


History Mode Waveform Playback
Scroll back in time to isolate anomalies and quickly find the source of the problem.


Identify and Isolate Problems Fast
Quickly locate analog or digital waveforms for runts, glitches or other anomolies with WaveScan


Save, Document, Report
Save all results and data with a single button press and create custom reports with LabNotebook


Spectrum Analyzer Interface
View ** details in the frequency domain with a spectrum analyzer style user interface


Serial Bus Trigger and Decode
View decoded protocol information on top of physical layer waveforms and trigger on protocol specific messages


Simple Power Measurements
Measure and analyze operating characteristics of power conversion devices and circuits